Step-By-Step Instructions
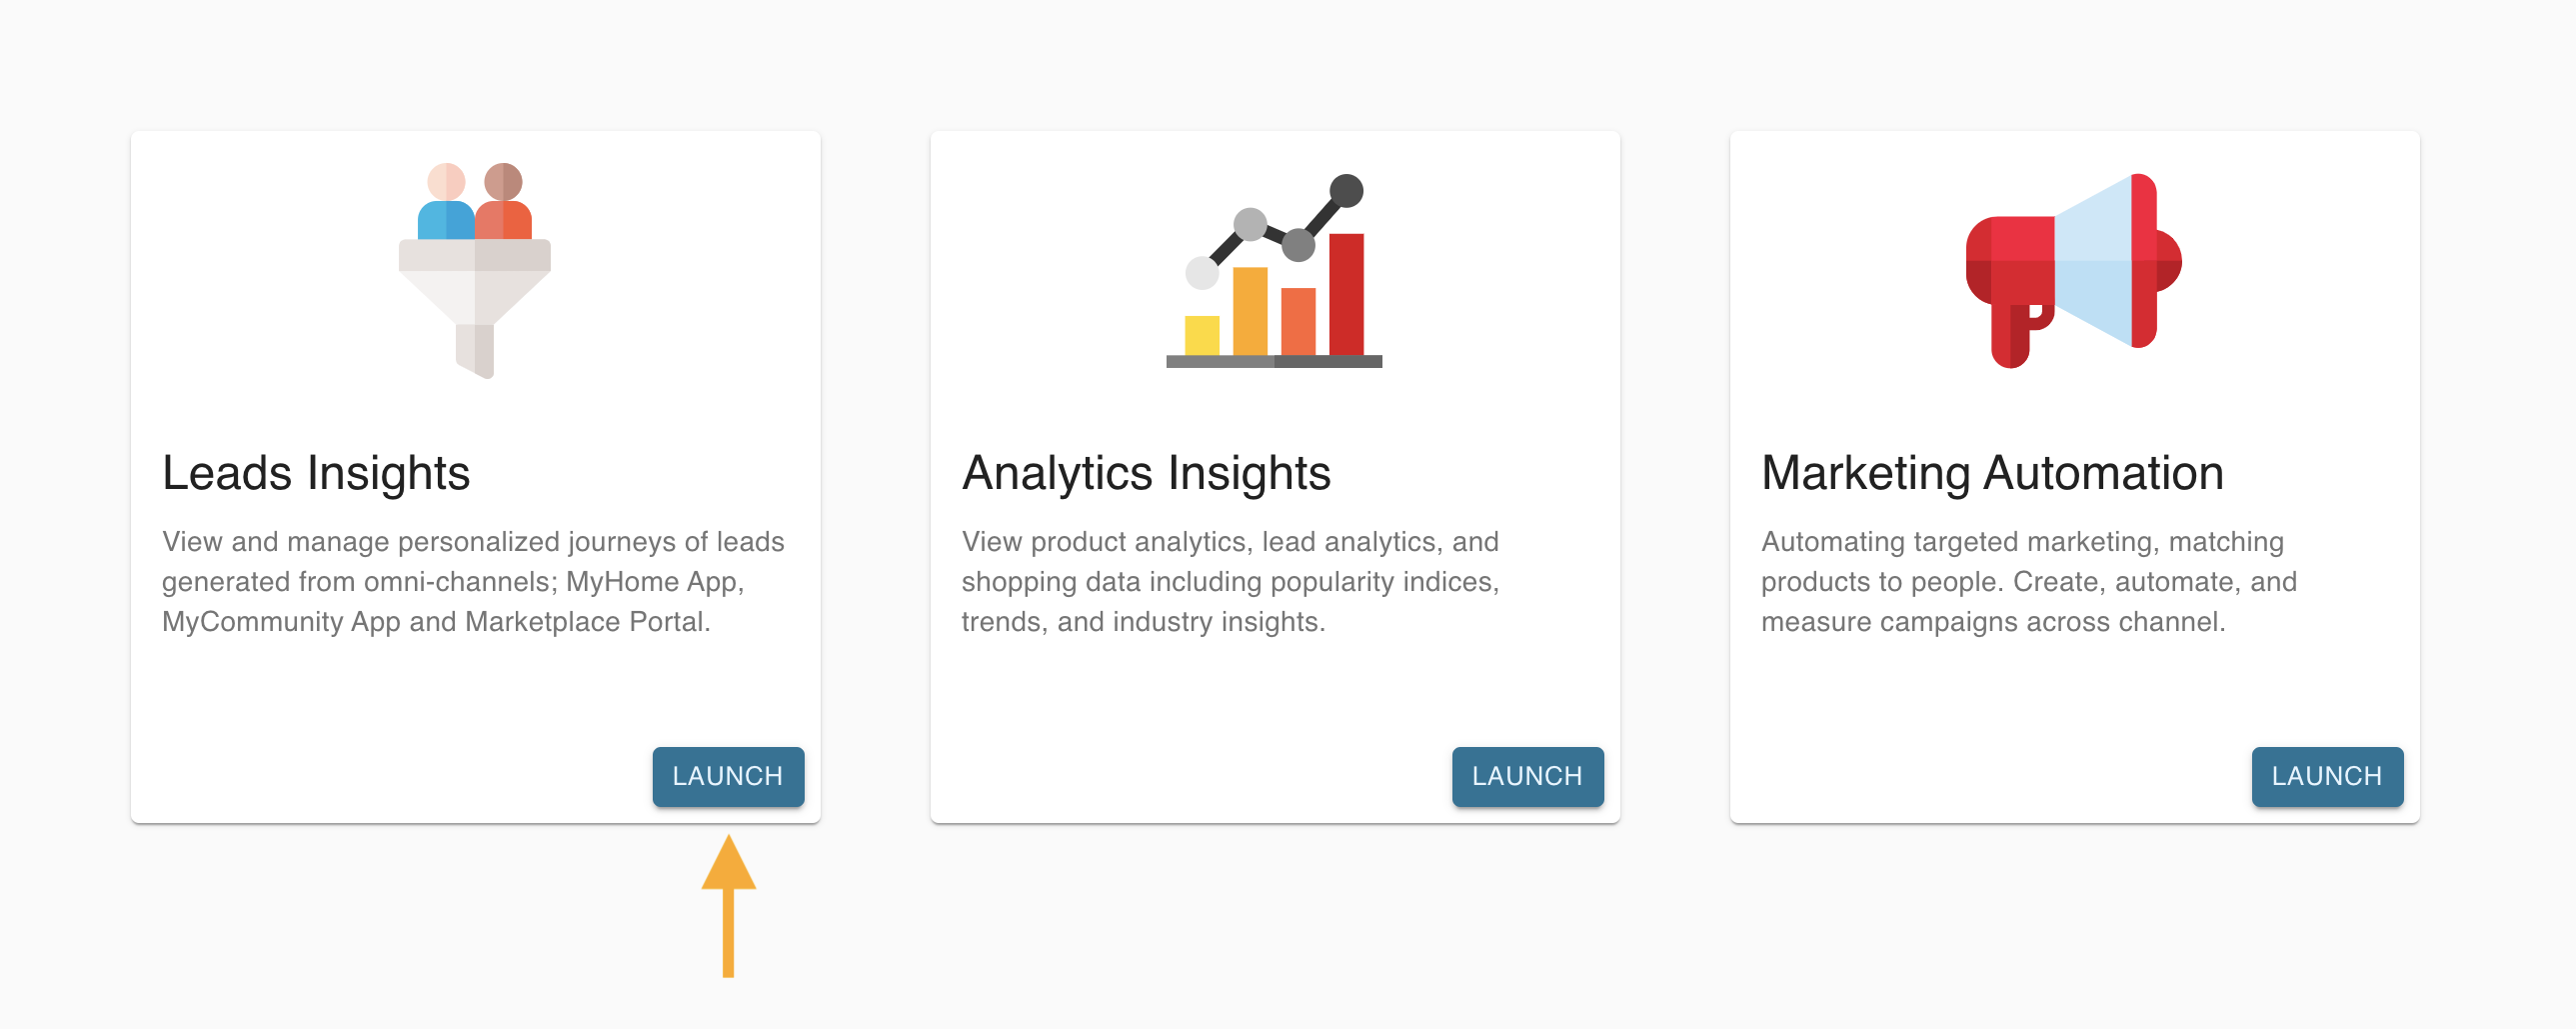
- Log into your Anewgo Insights Account. Click “Launch” on Leads Insights.
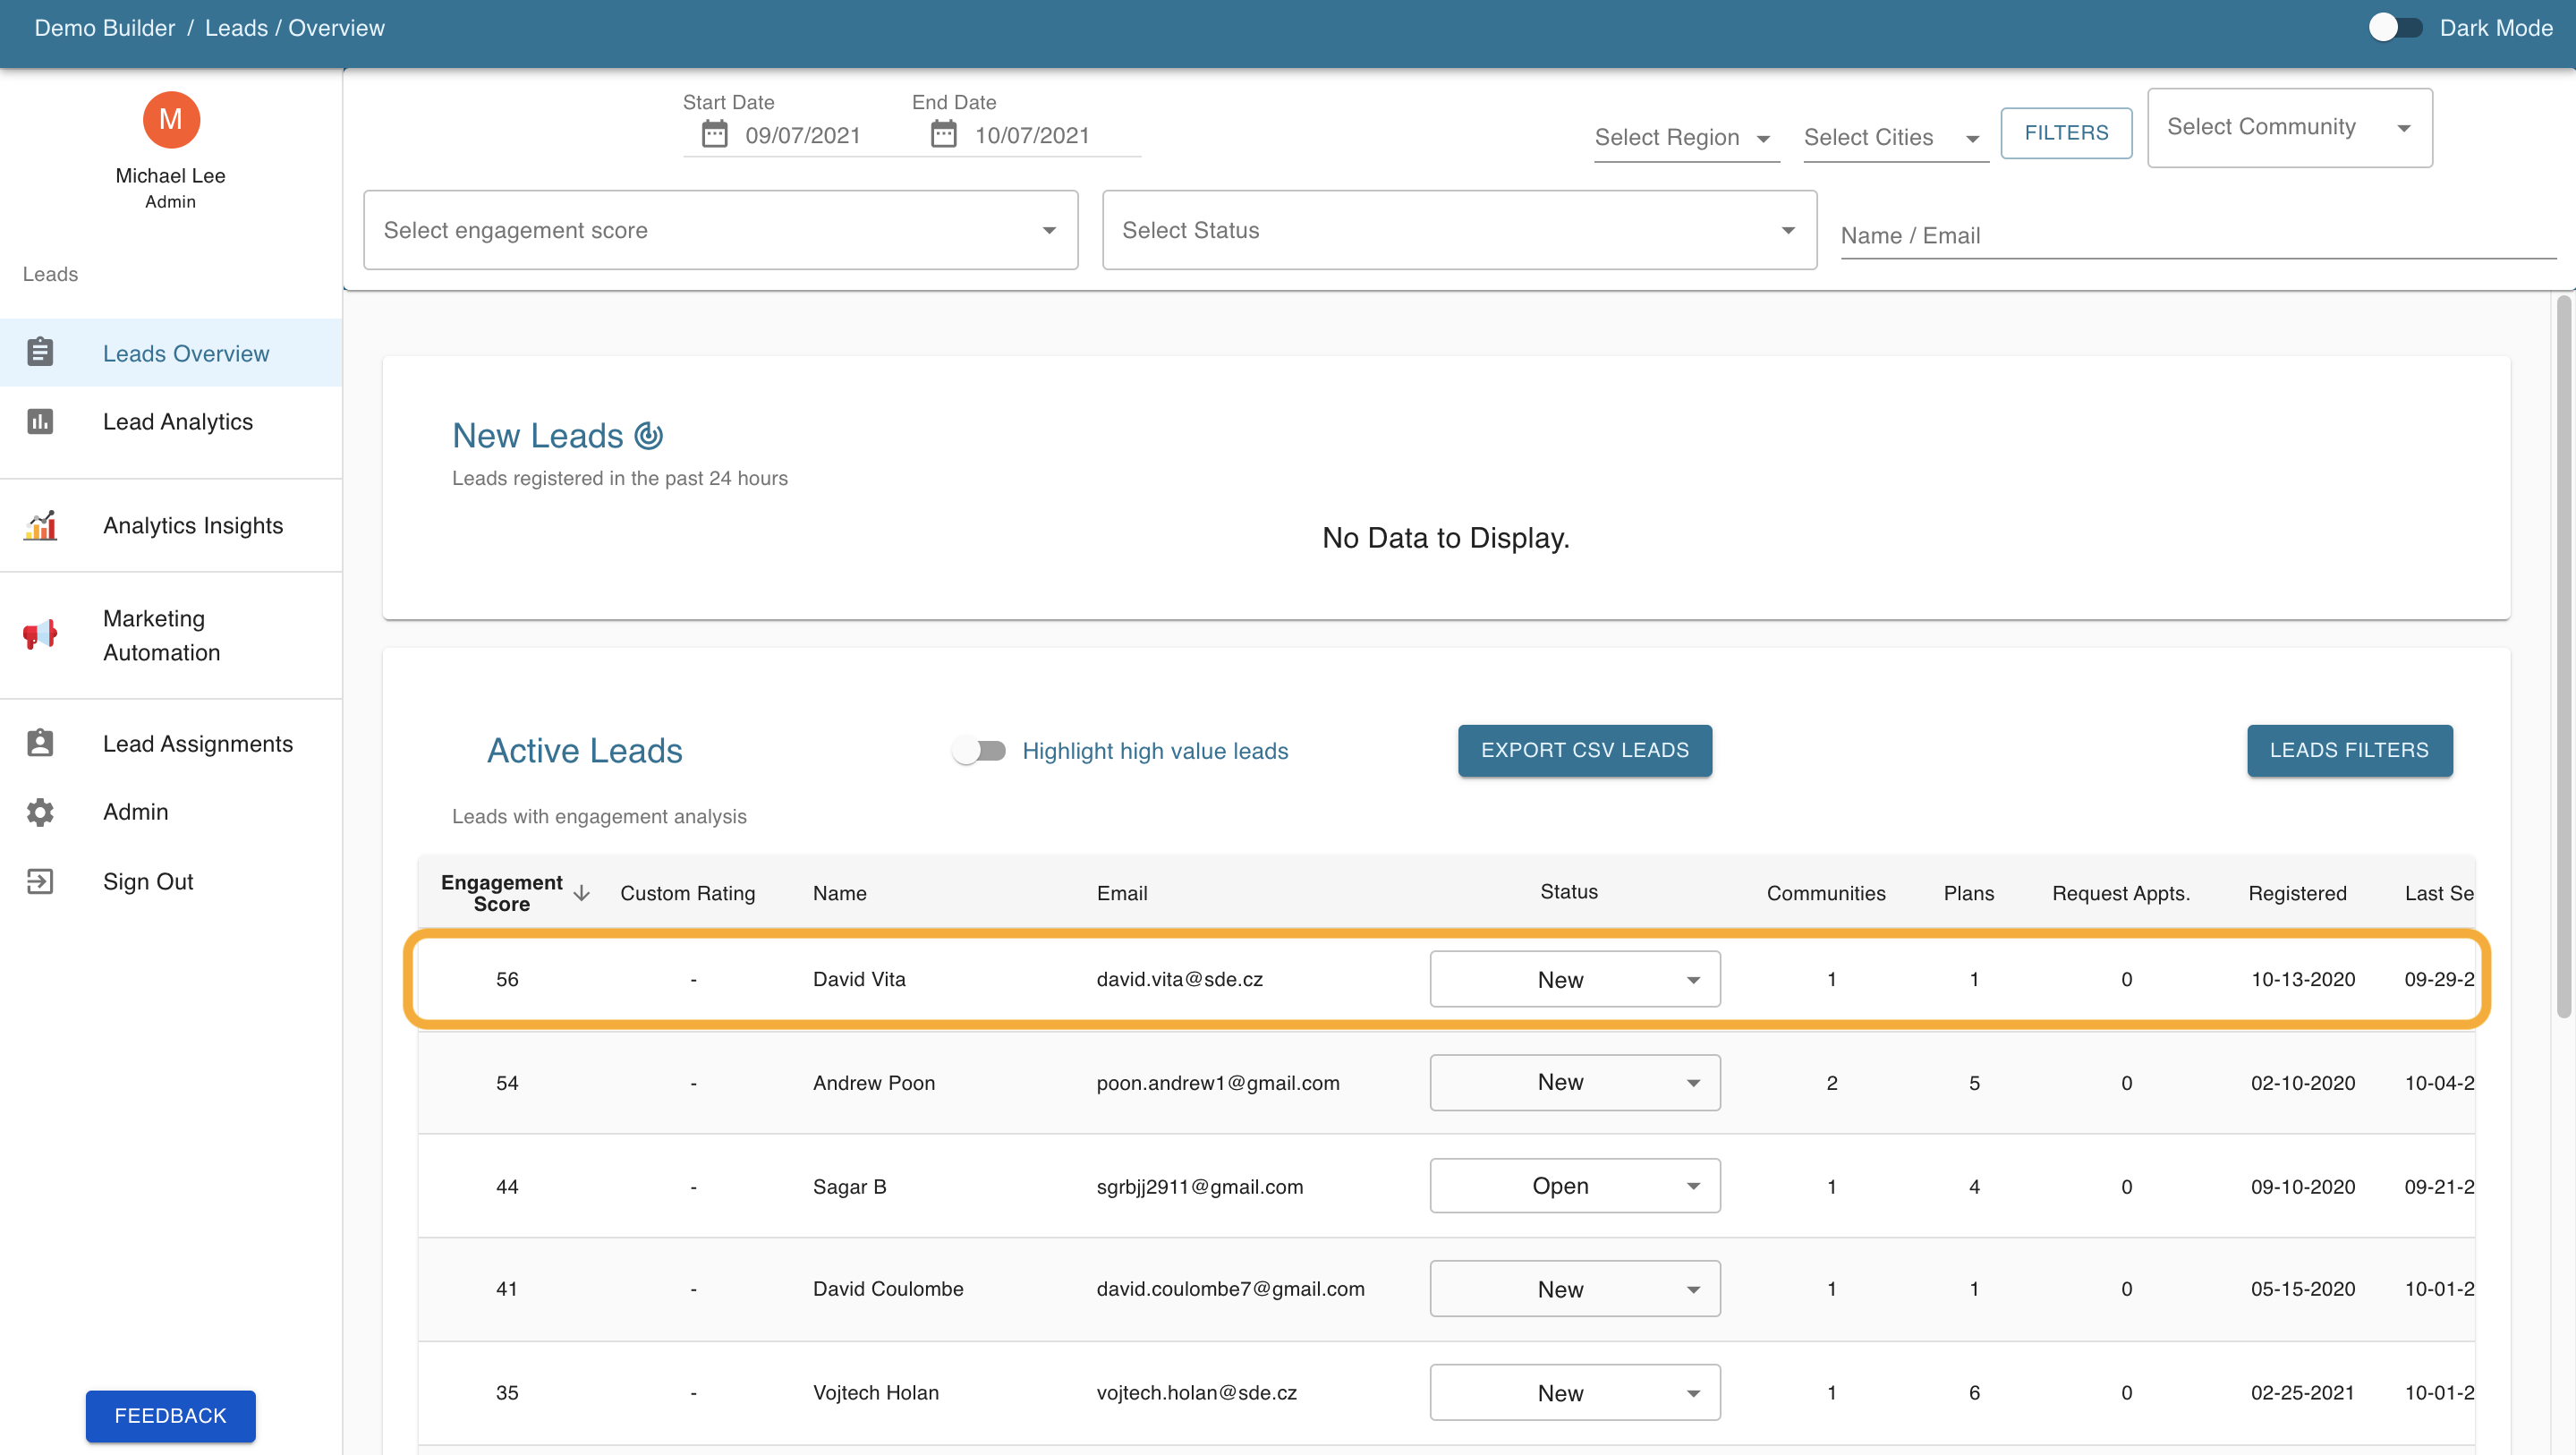
2. The Leads Overview page displays two tables: New Leads and Active Leads. At the top is a variety of filters that can be used to narrow leads based on specific criteria.
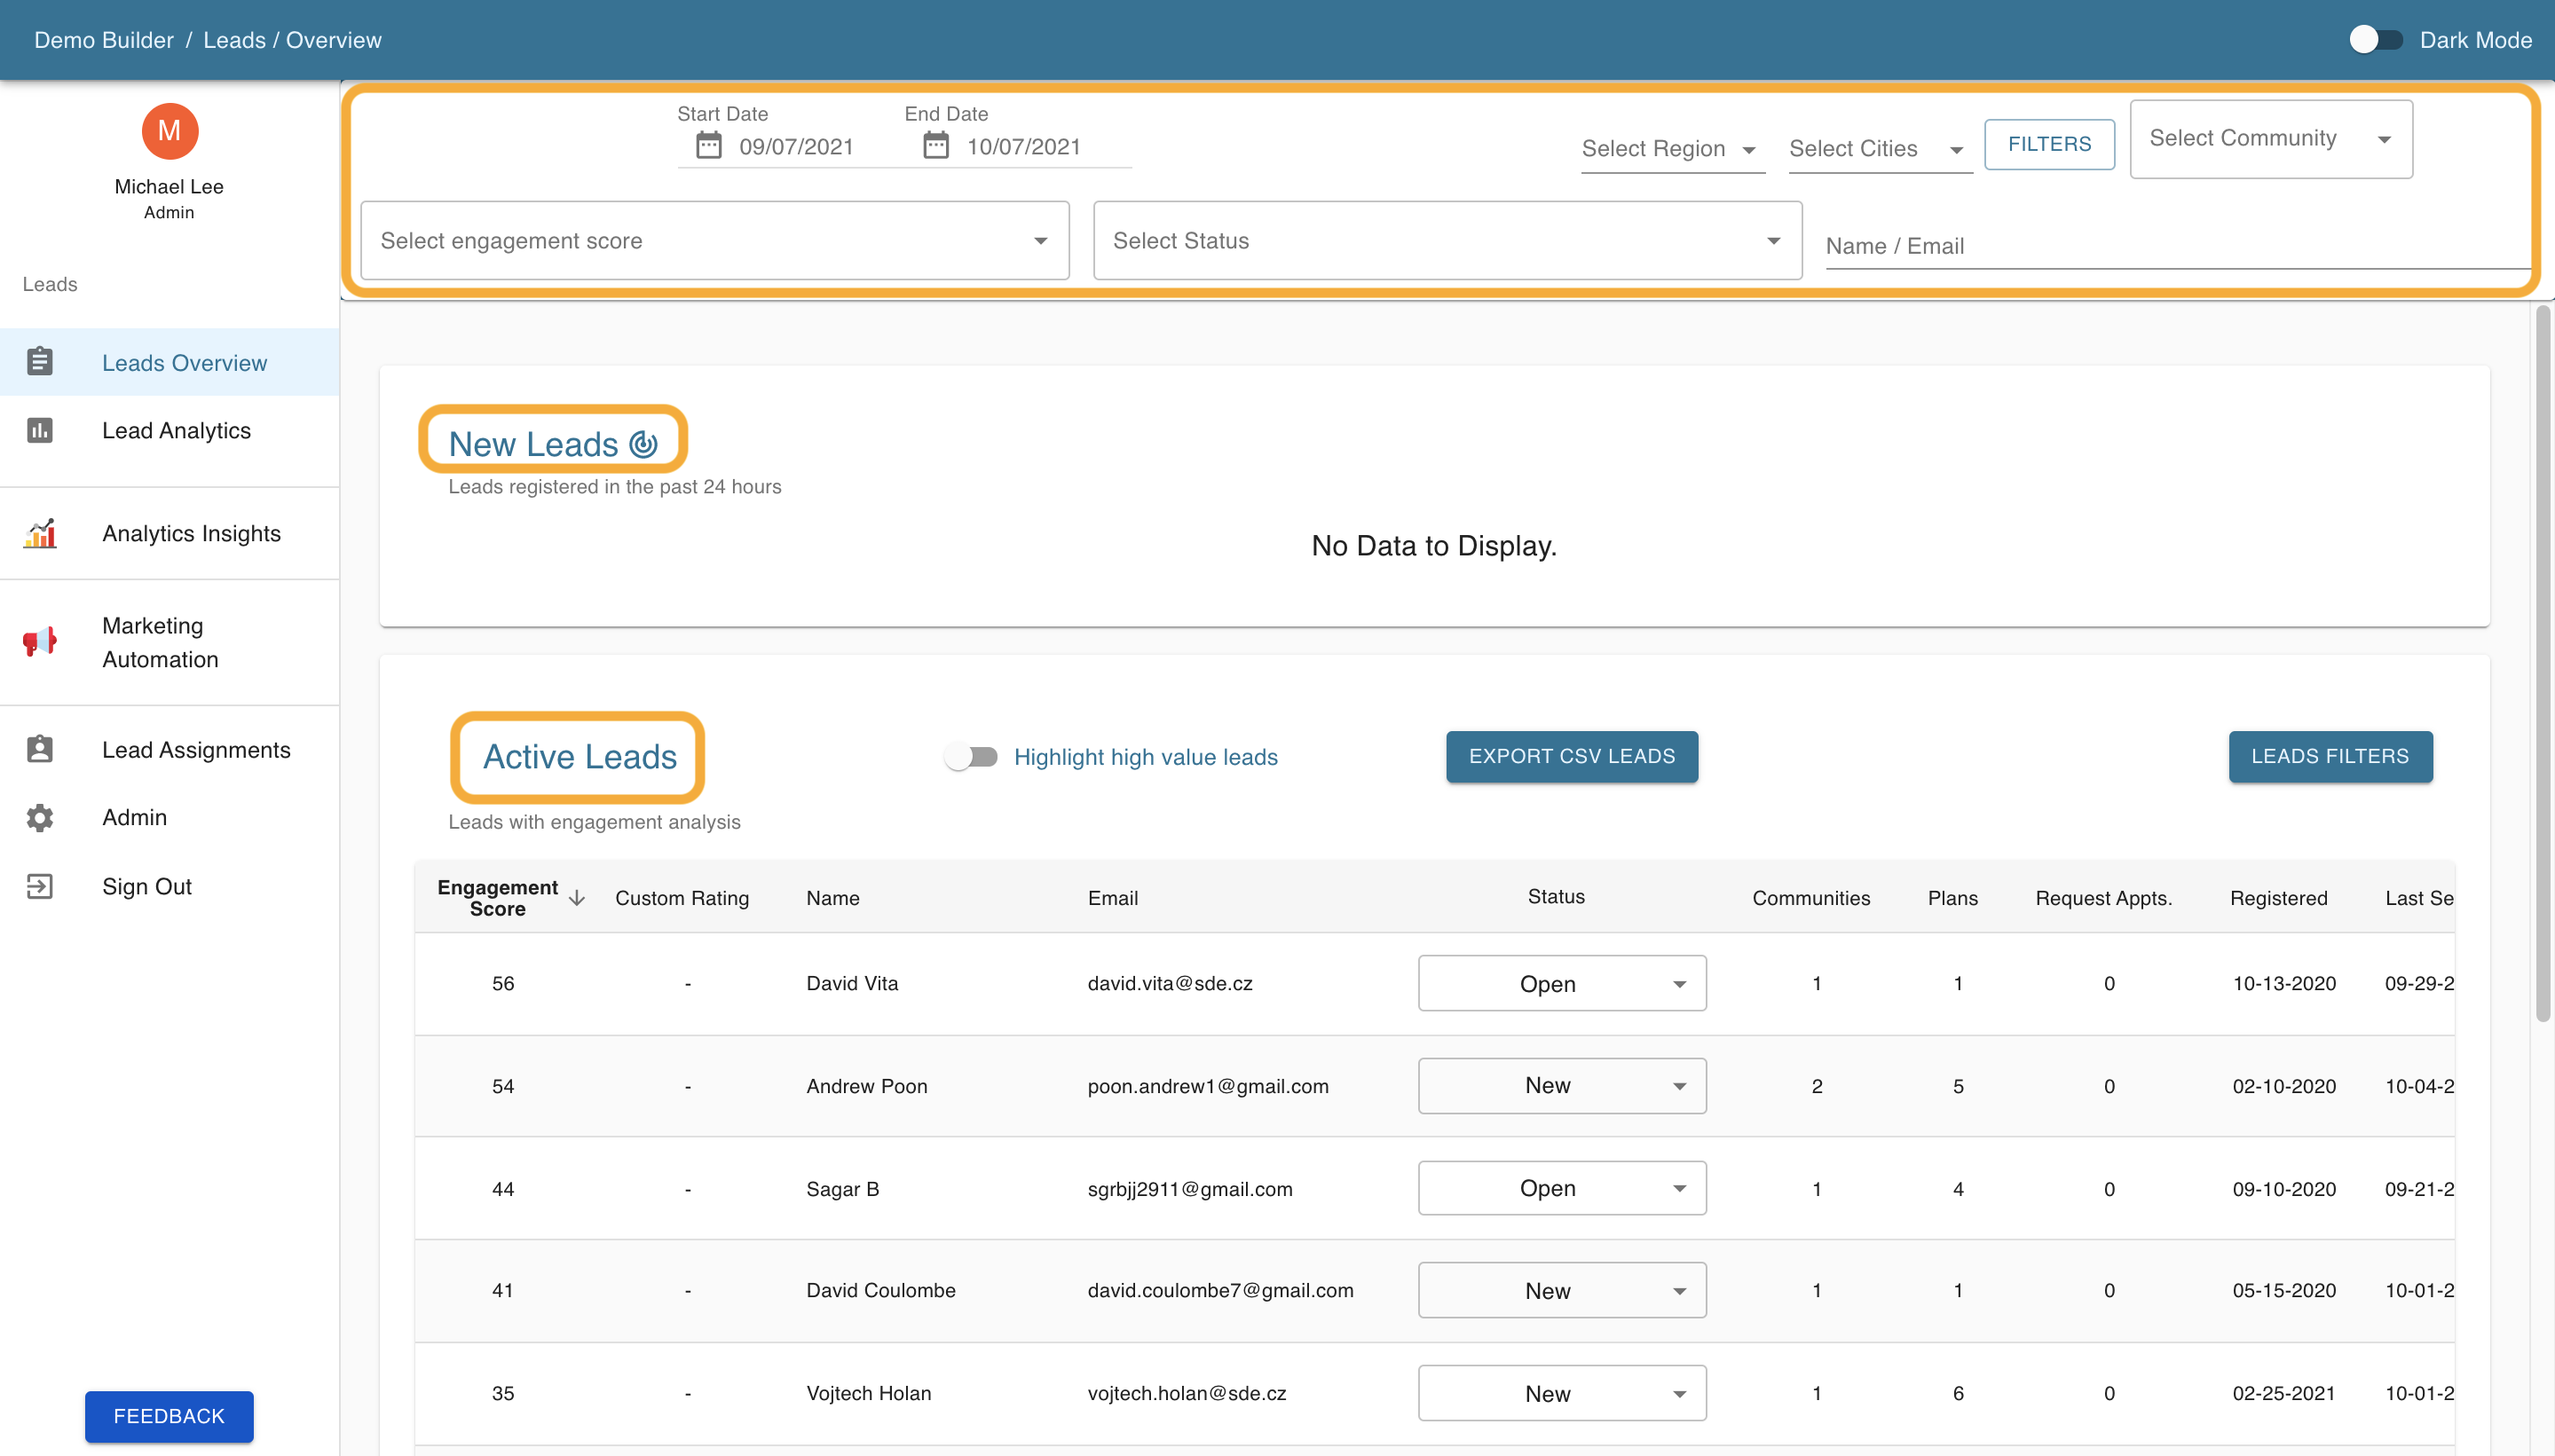
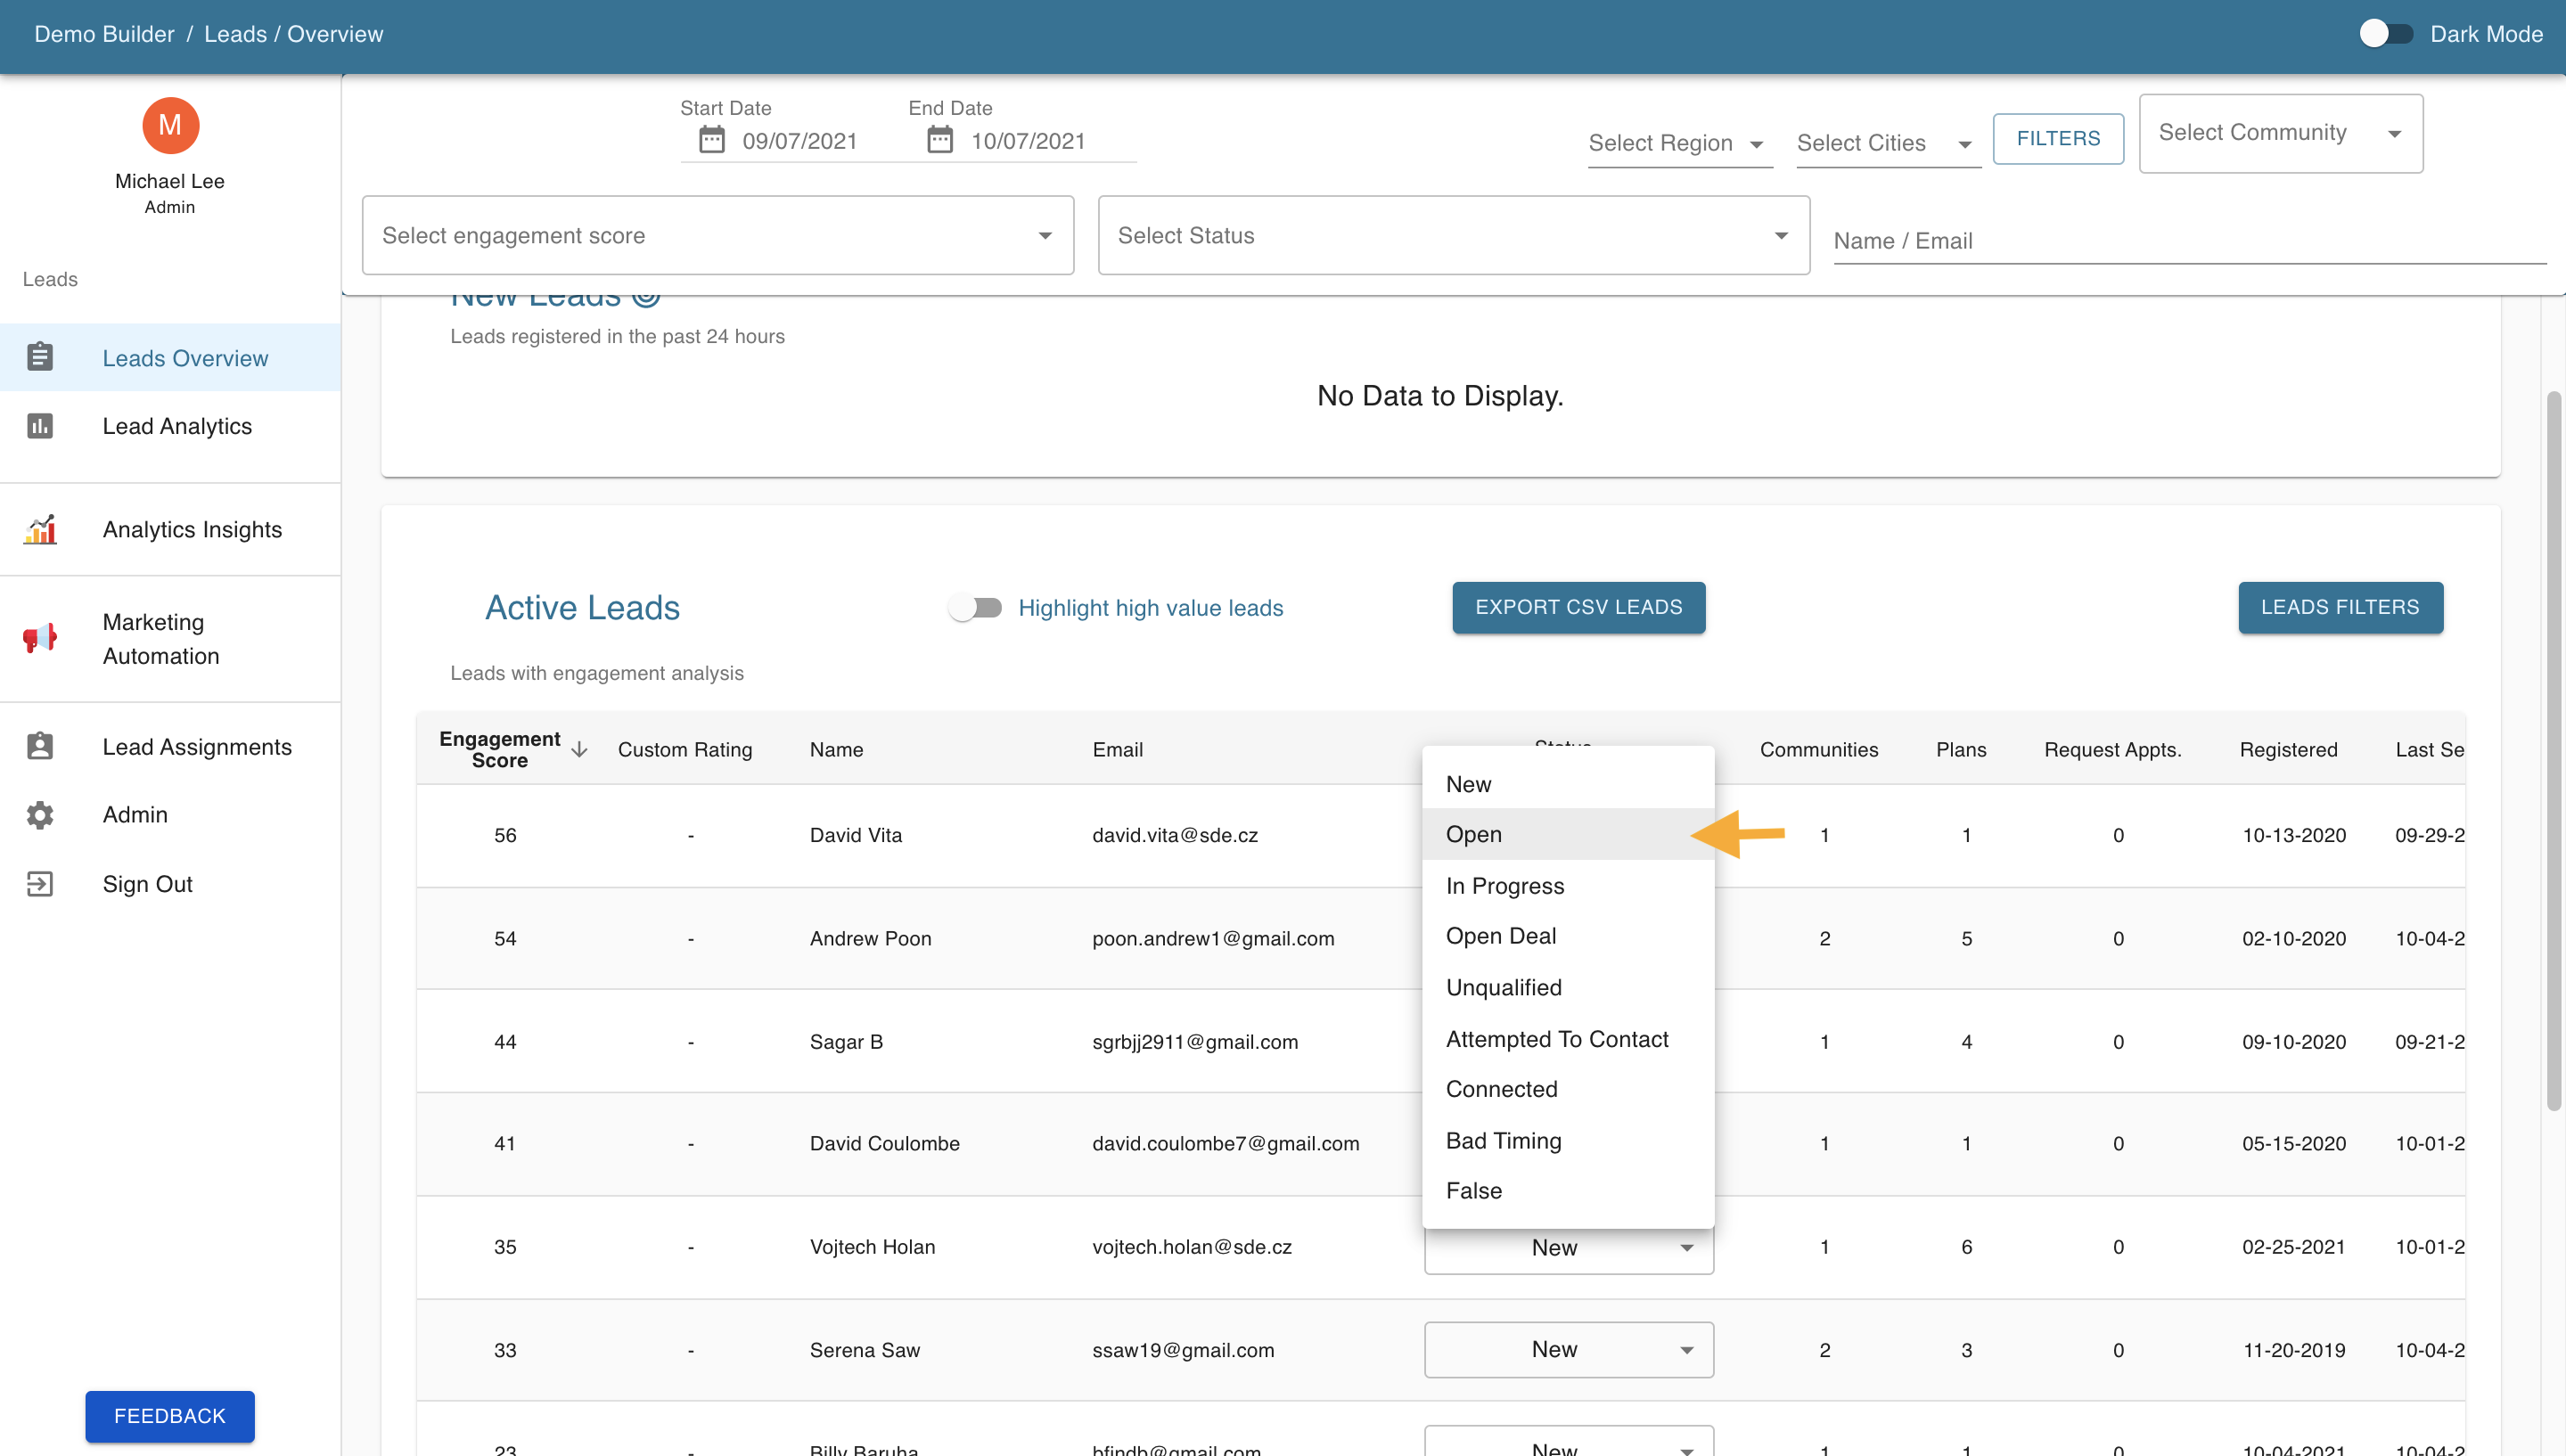
3. The tables contain a Status variable that can be changed for each lead to keep track of what stage the lead is at in the sales process.
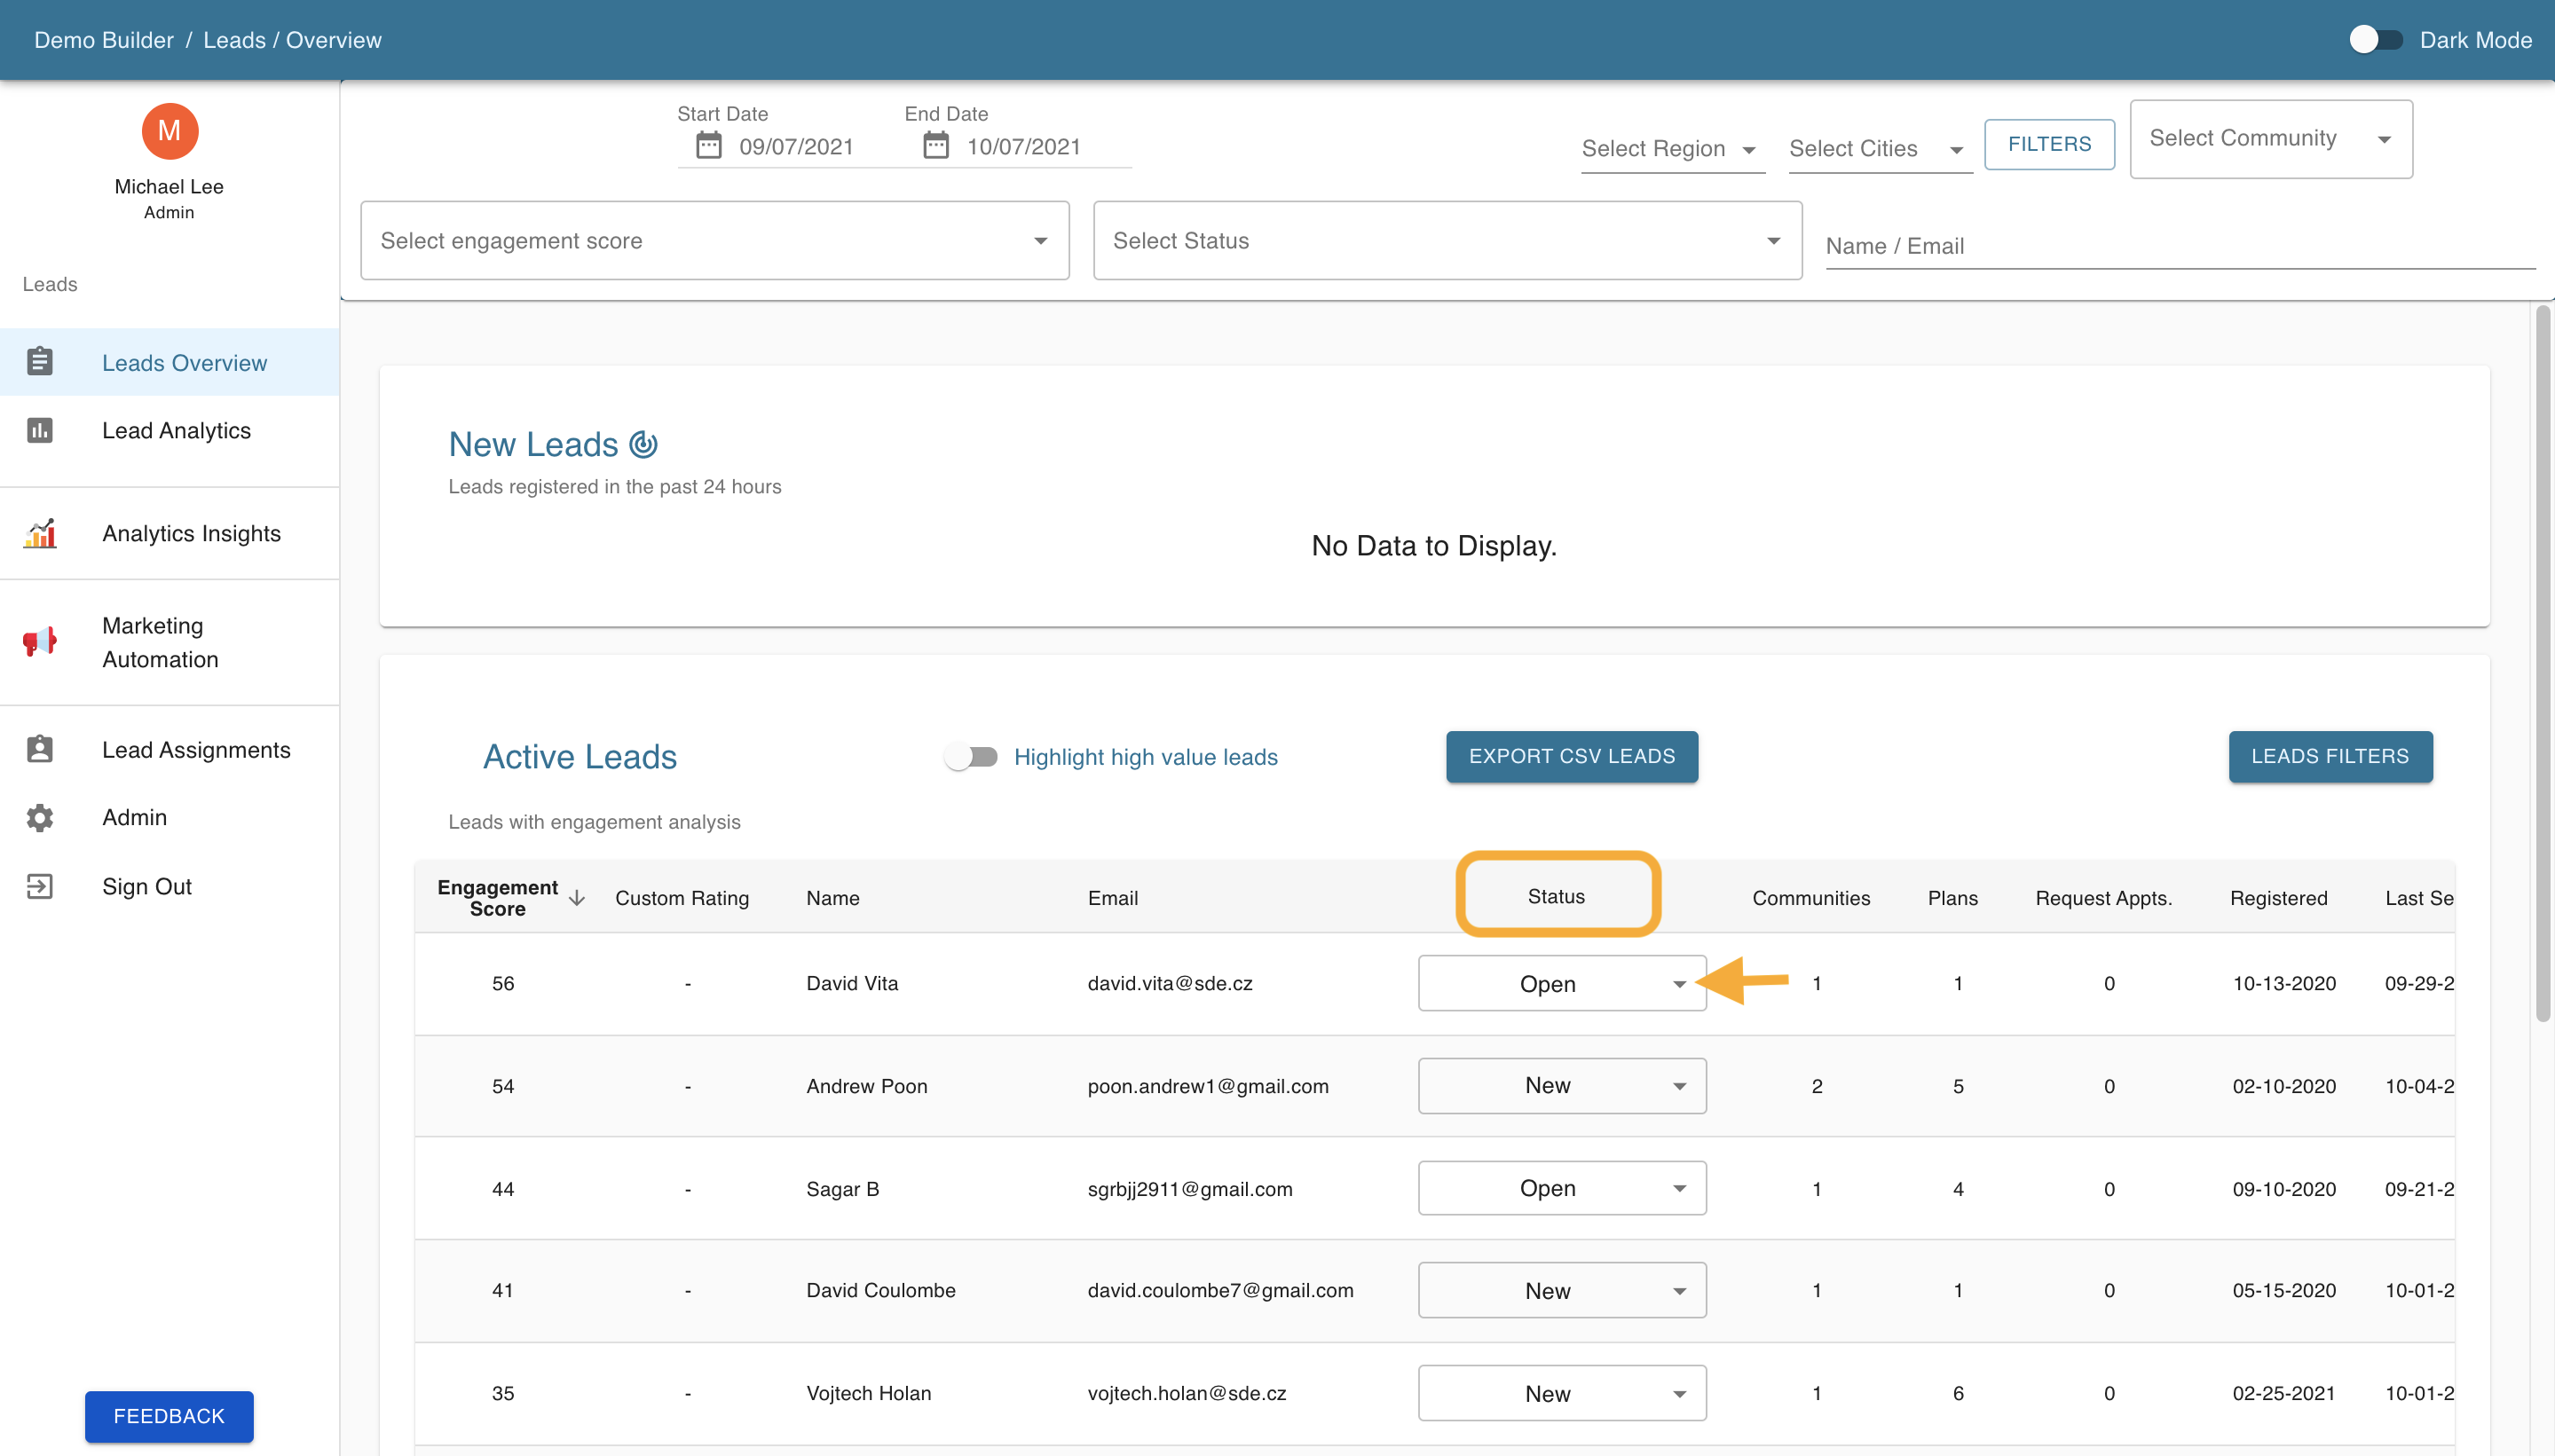
4. Choose the status from the drop down menu.
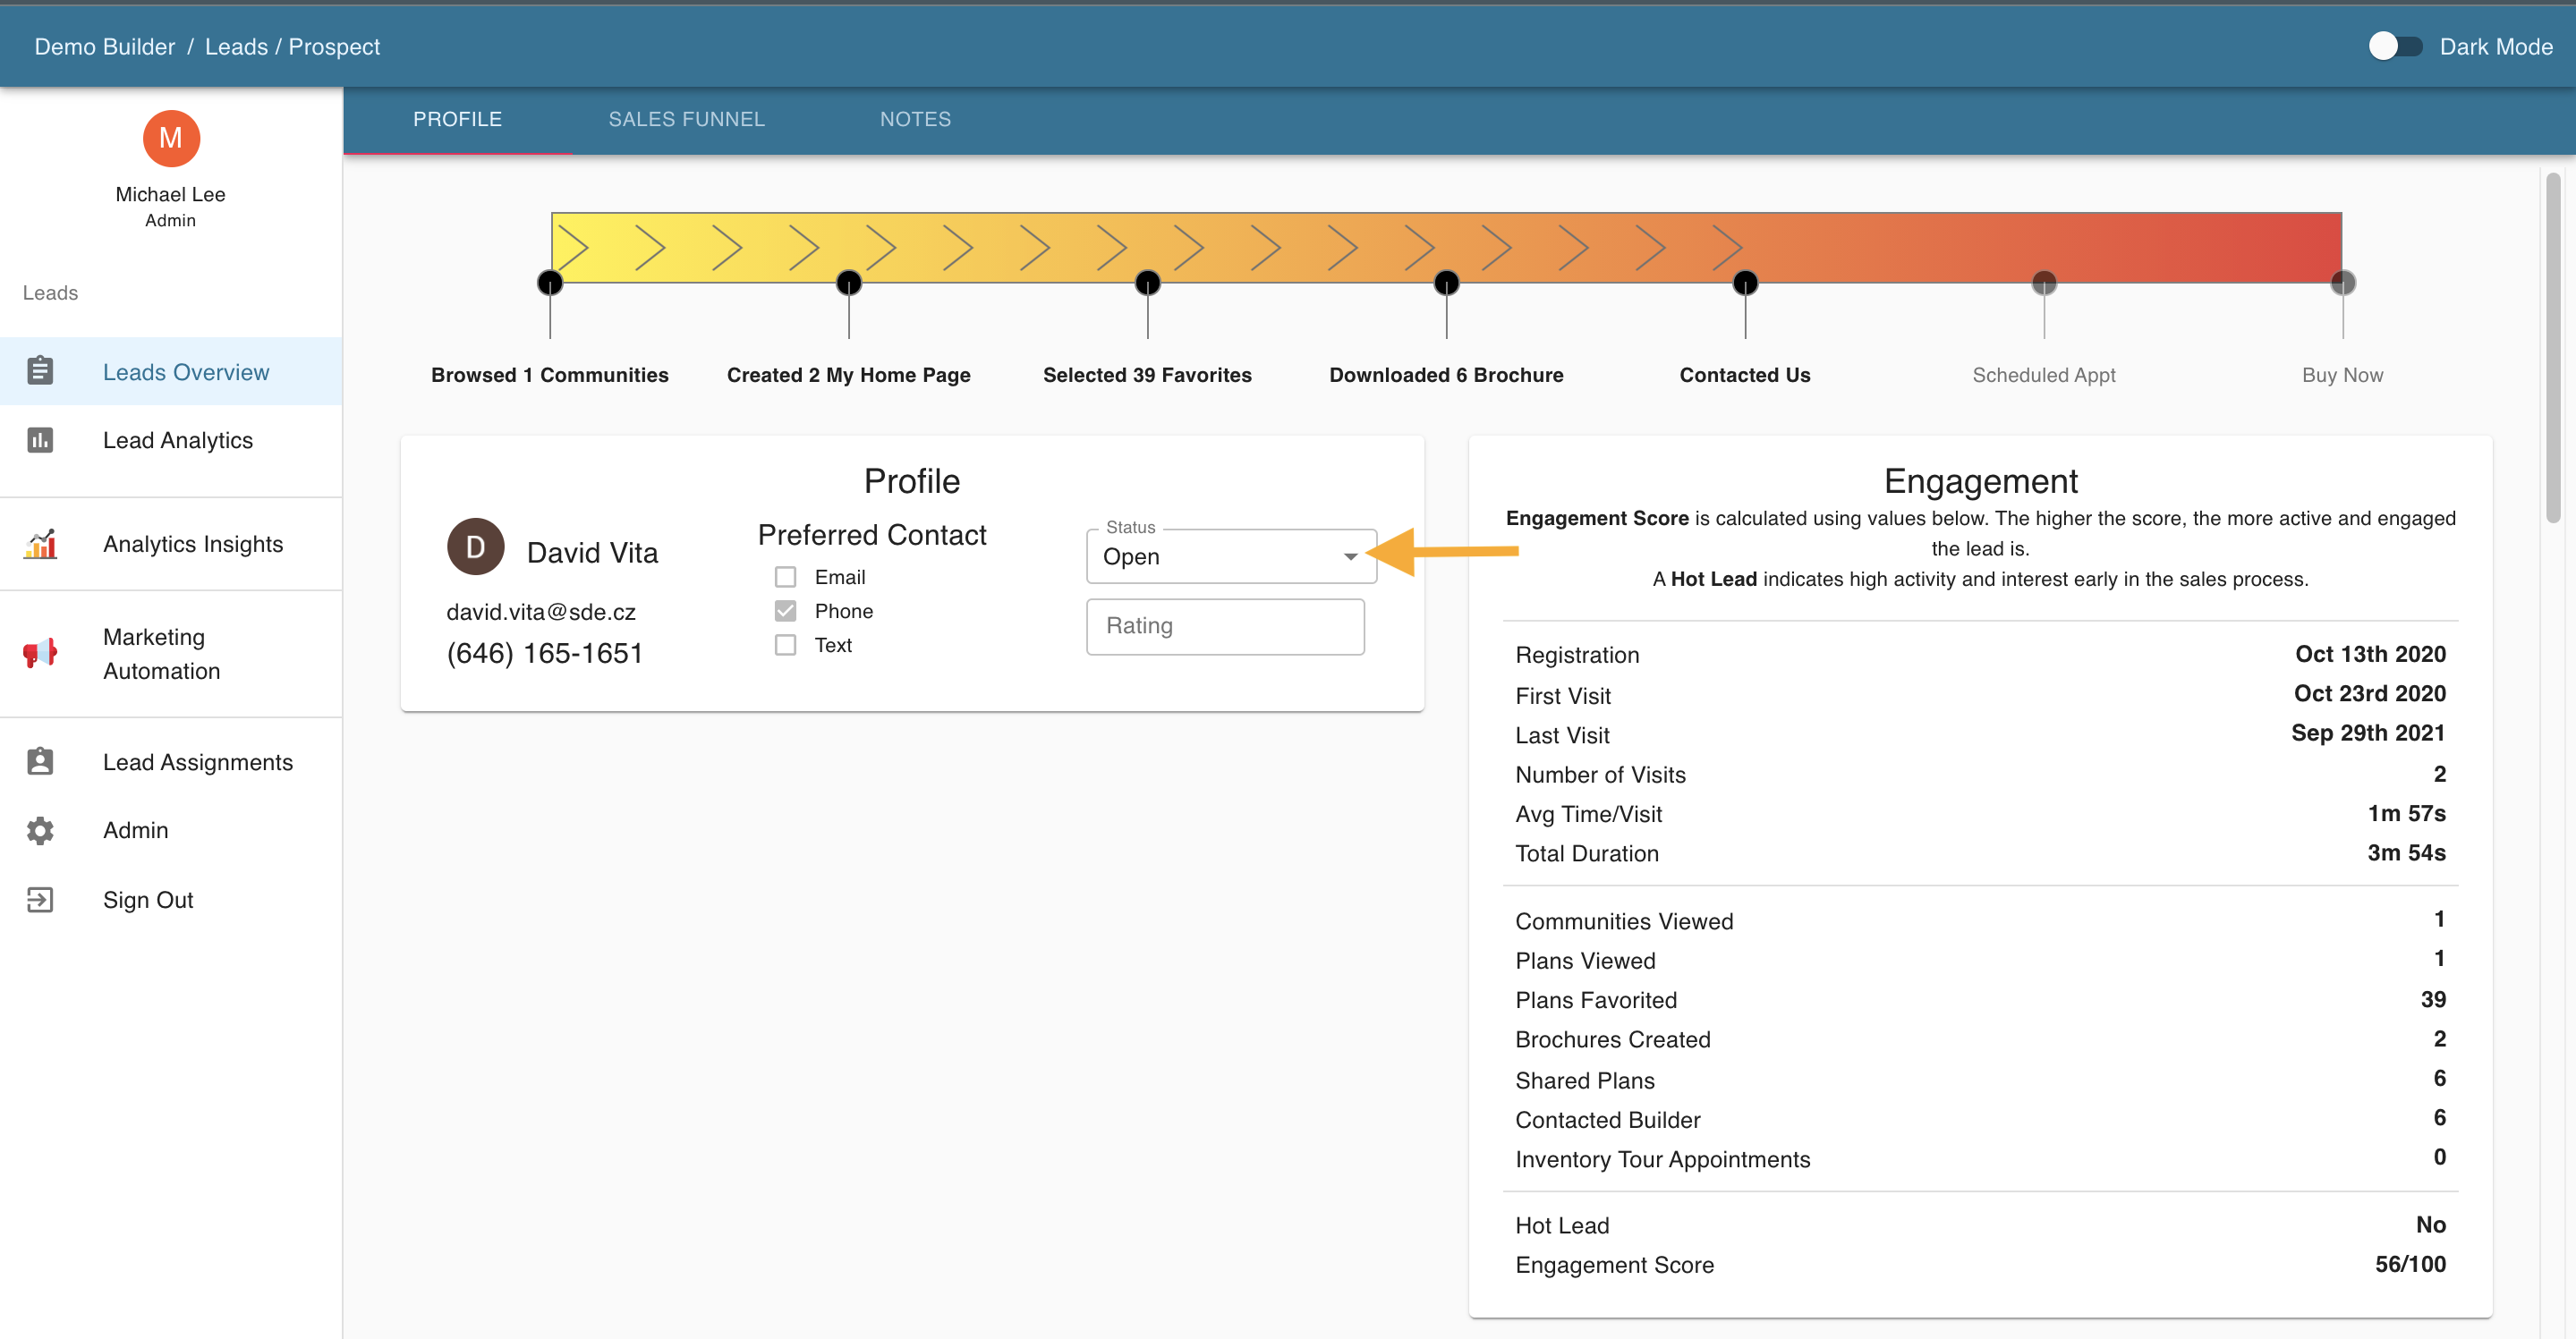
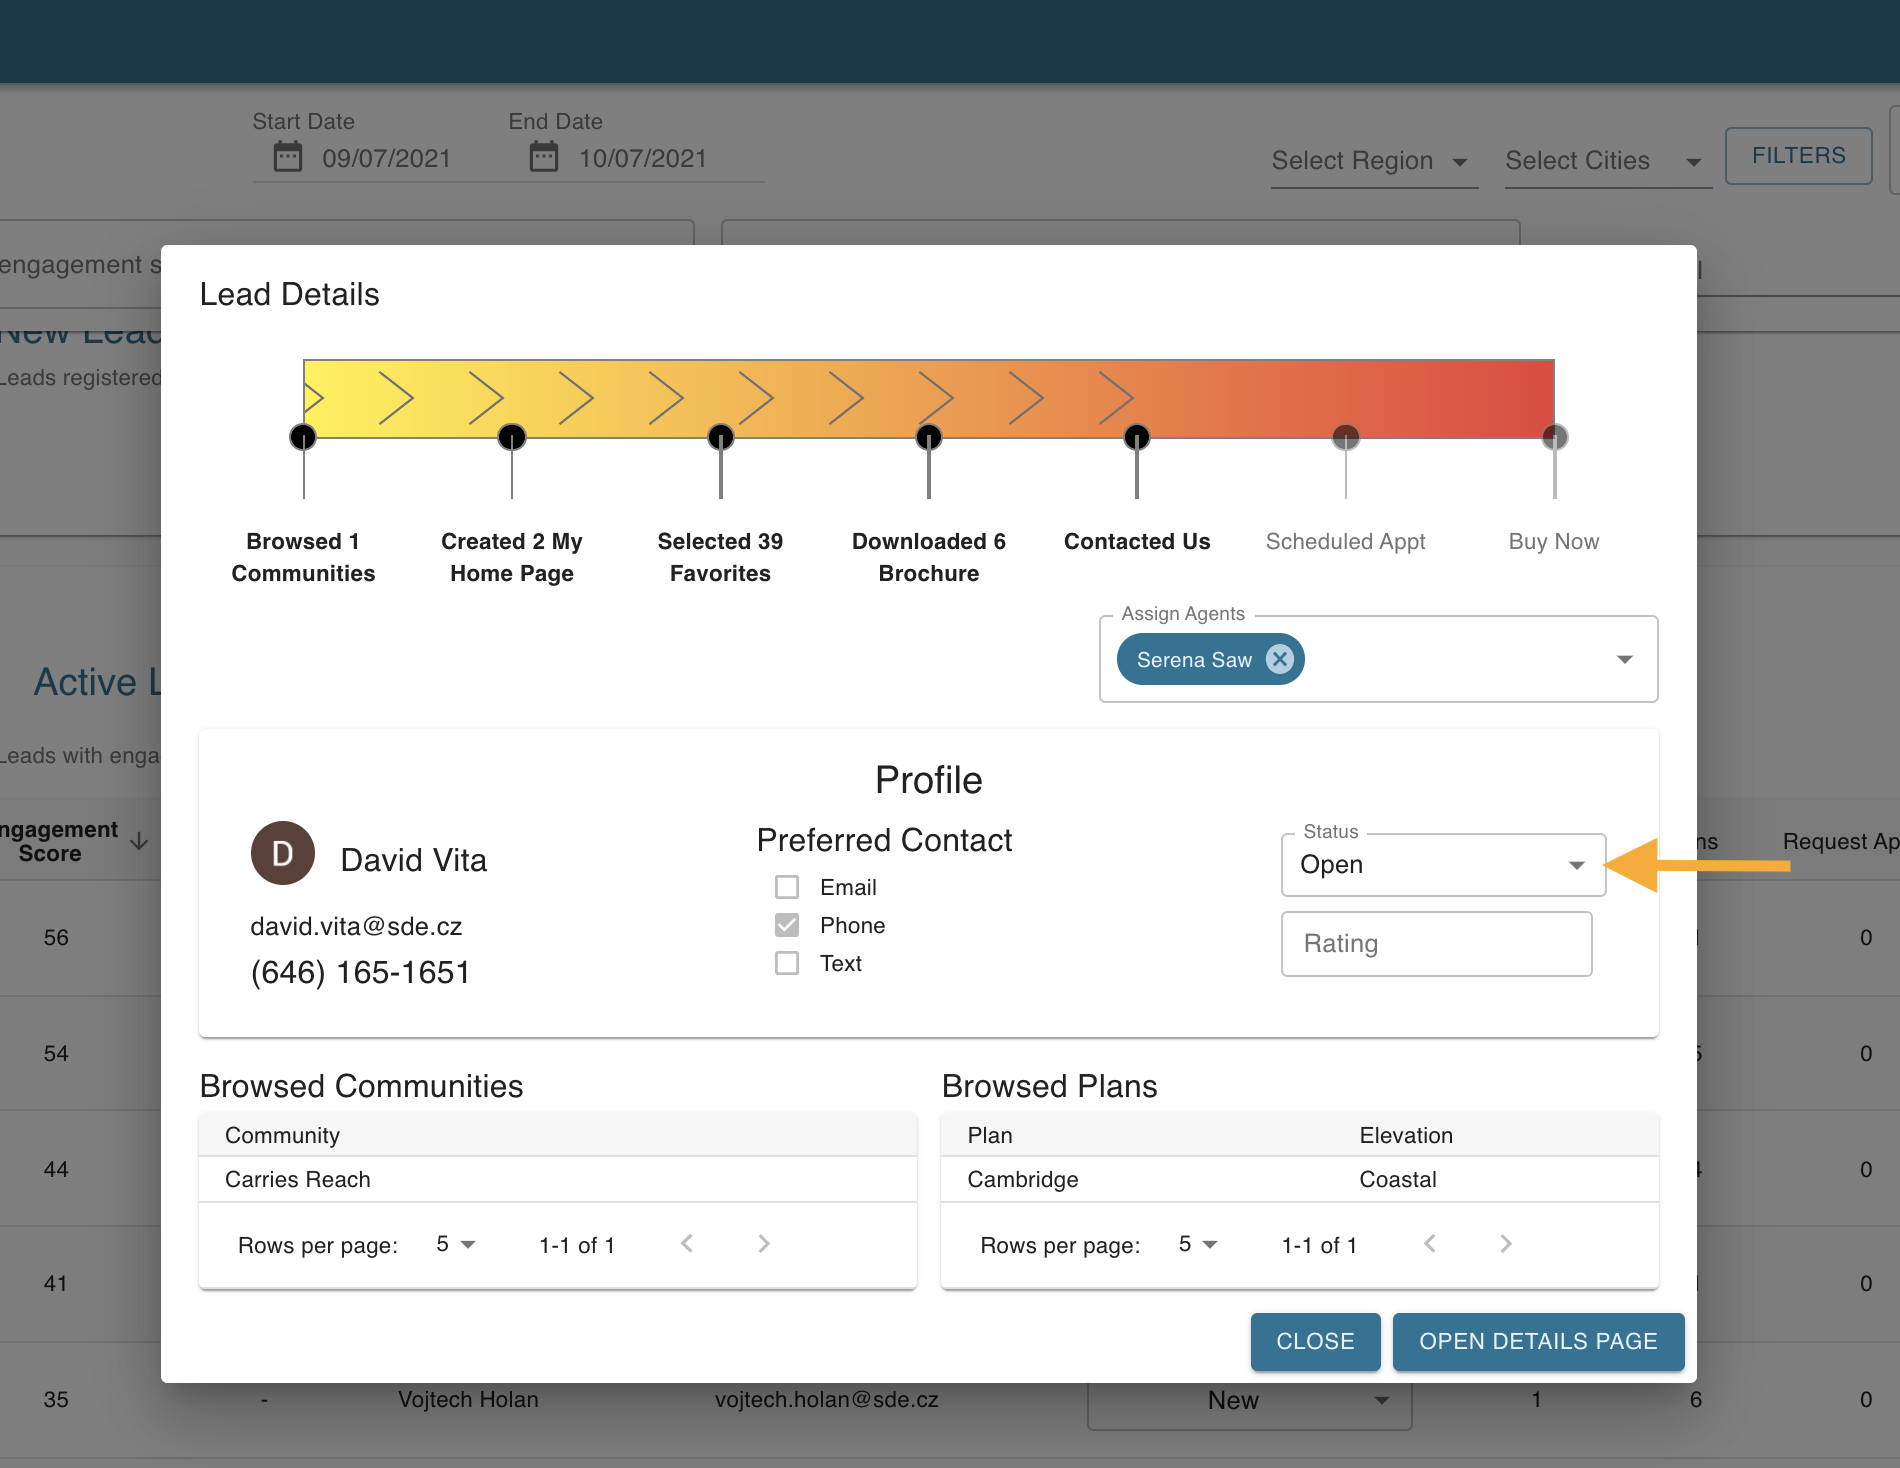
5. To further analyze a lead, you can click on the row and get a quick report about the lead and how they interacted with your products.
6. You can also update the status here.
7. If you want to view engagement scores and a more detailed report, click “Open Details Page” where you can view the analytics for that specific lead.
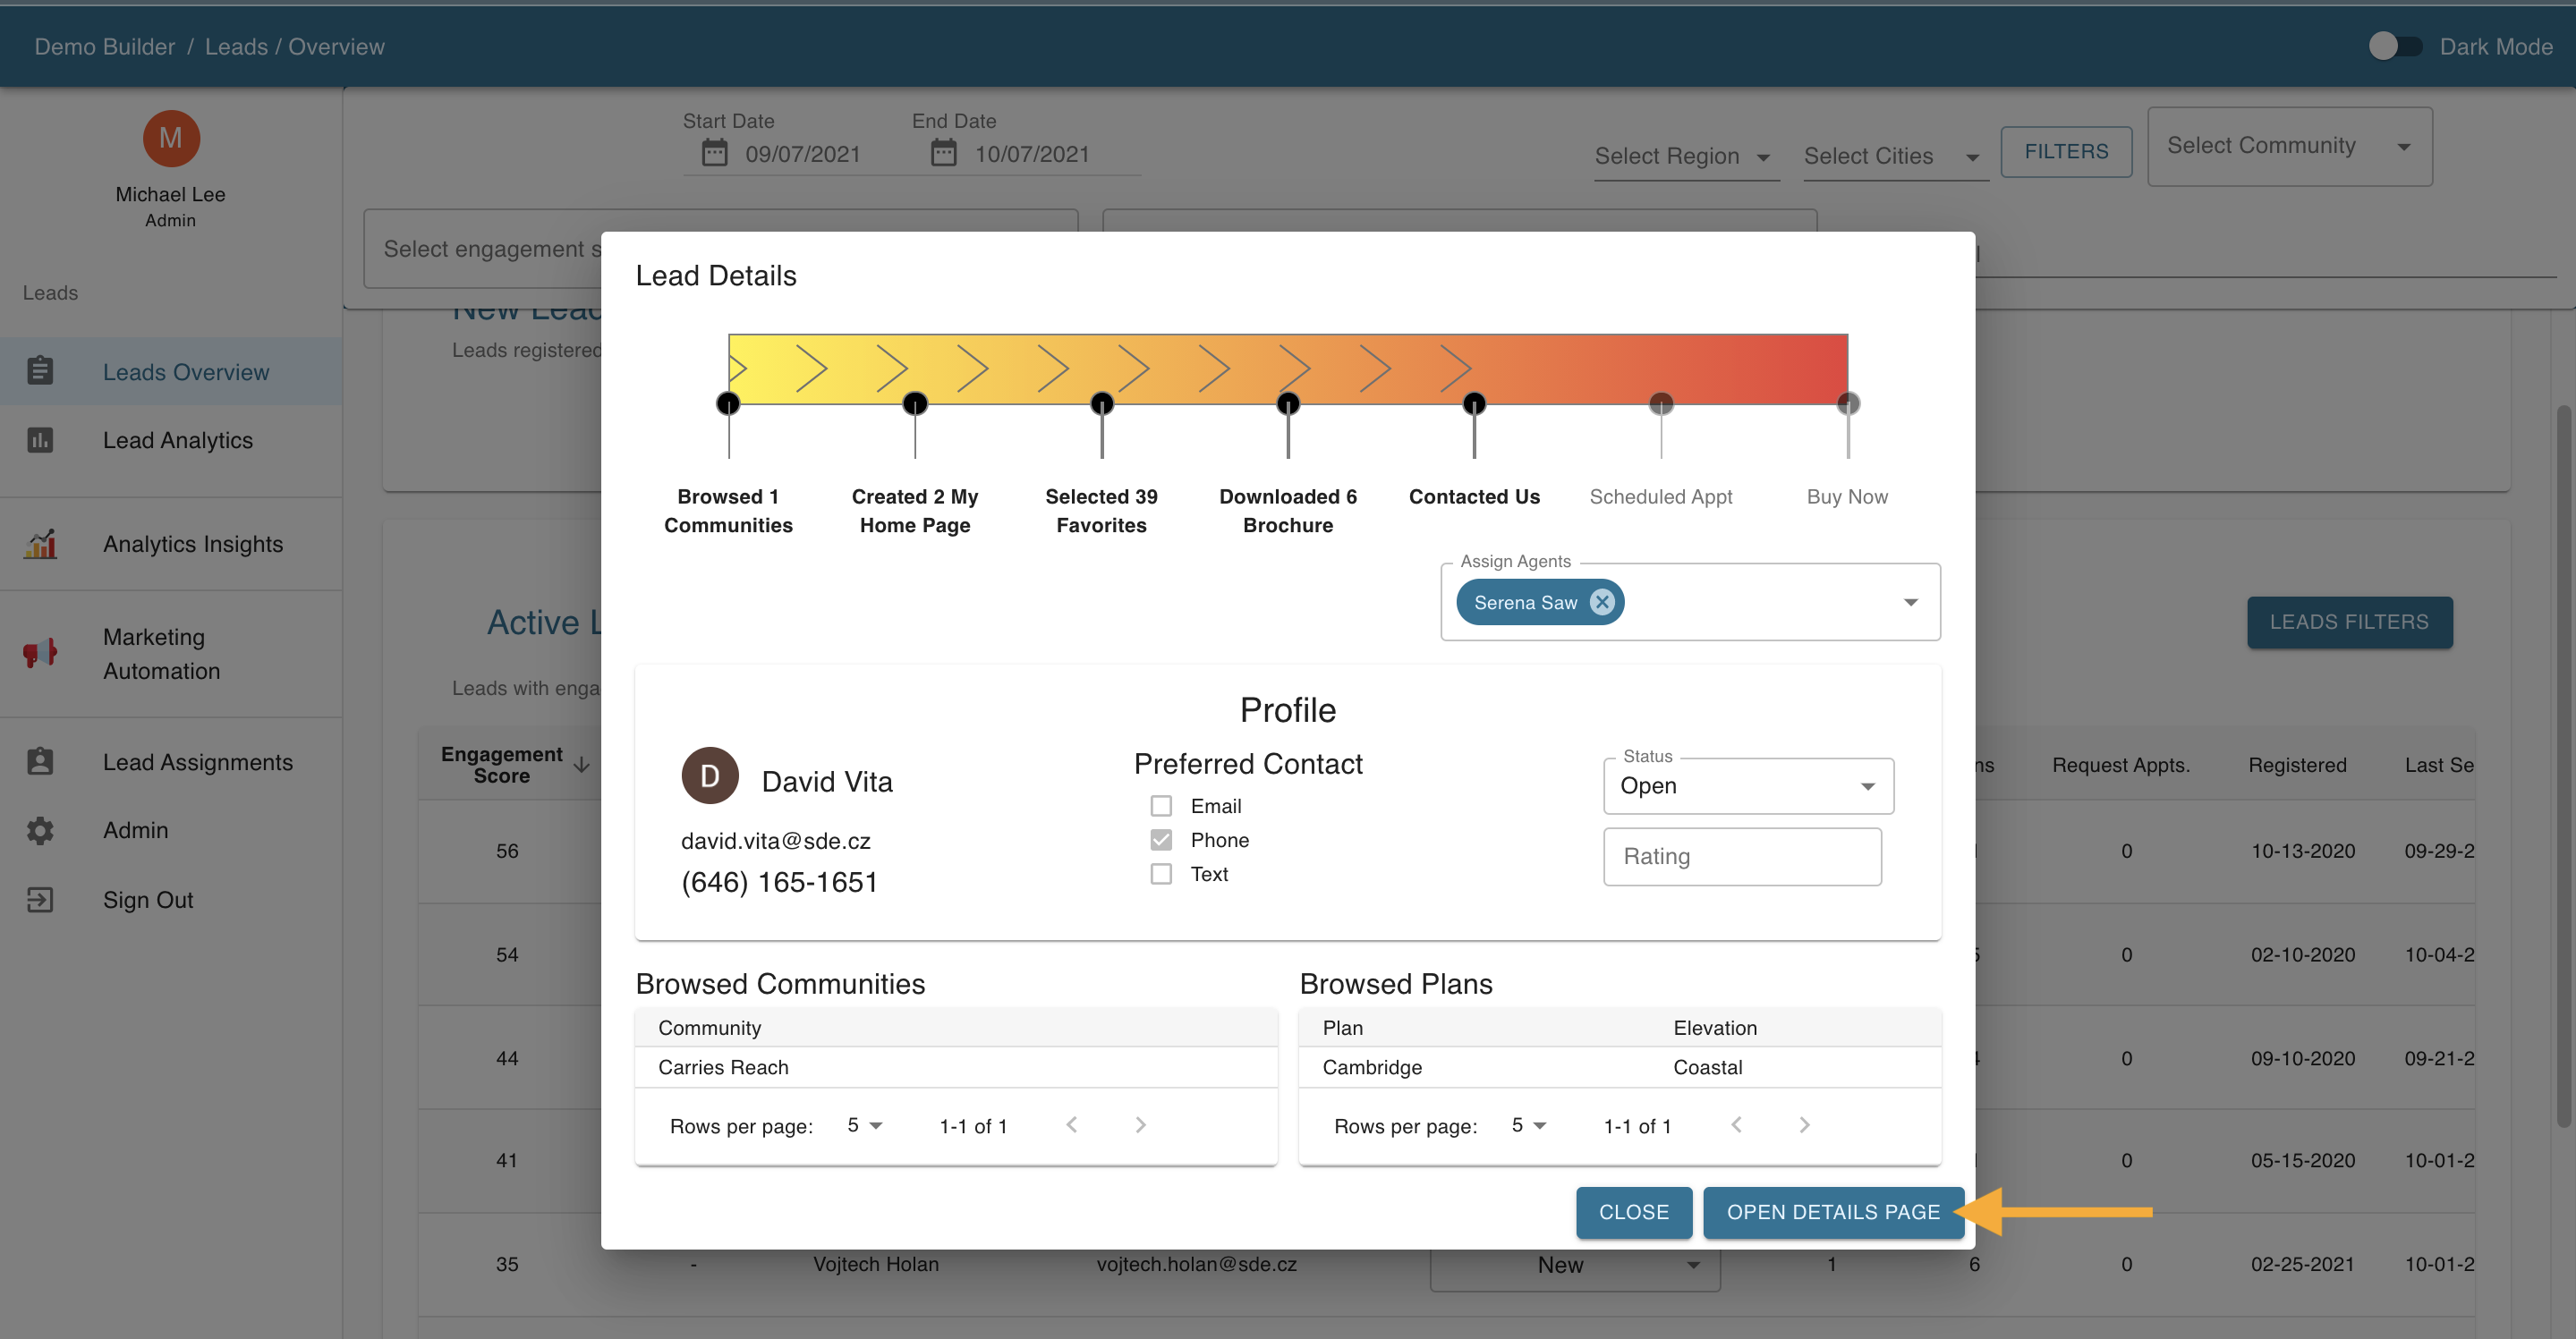
8. You can also update the status here once again.